Article • 13 min read
A guide to customer satisfaction surveys: Top questions, examples, and templates
Asking the right customer satisfaction survey questions will provide key insights into what's working and what isn't so you can enhance the customer experience and increase retention.
By Stella Inabo, Contributing Writer
Last updated April 4, 2024
Download templates
Businesses must deliver the best possible experiences for customers. If they don’t, they may pay the price: 73 percent of customers will switch to a competitor after multiple bad experiences—and more than half will switch after a single unsatisfactory experience, according to the Zendesk Customer Experience Trends Report 2023.
To minimize poor customer experiences and boost customer retention, you must request feedback and listen to your buyers. But where do you start?
An effective way to get feedback is through customer satisfaction surveys. But sending a random set of customer satisfaction survey questions every now and then won’t help you improve your customer experience. To obtain meaningful feedback, create surveys with a goal and carefully craft questions that help you collect relevant data.
In this guide, learn about the basics of customer satisfaction surveys, survey question examples, types of surveys, benefits of customer satisfaction surveys, and best practices to follow.
- What are customer satisfaction surveys?
- Benefits of customer satisfaction surveys
- 50+ customer satisfaction survey questions
- Types of customer satisfaction surveys
- What to do with your customer satisfaction survey results
- Customer satisfaction survey templates
- Best practices for designing a customer satisfaction survey
- Customer satisfaction survey examples
- Turn survey responses into action
What are customer satisfaction surveys?
A customer satisfaction survey is a list of questions used to measure what consumers think about a business and its products or services. The primary purpose of customer satisfaction surveys is to gather customer feedback about anything from the ease of using a product to the quality of service provided by customer support agents.
Customer satisfaction survey responses reveal opportunities for growth and areas where the company is lagging behind. By acting on this input and addressing the weak spots, support leaders can offer better customer experiences—leading to greater customer acquisition and retention.
Benefits of customer satisfaction surveys

Customer satisfaction surveys enable you to understand customer expectations and see where your business is falling short and where it’s excelling. Based on these insights, you can form a plan on how to improve your support experience and strengthen customer relationships. Read on for the benefits of customer satisfaction surveys.
Helps you build better products
Satisfaction surveys are the product team’s secret weapon. Customer feedback tells you if your buyers love (or hate) what you’ve created—so you don’t have to guess.
Say your company offers a project management tool for startups. On calls, customers complain that they keep missing deadlines because they can’t distinguish between messages and assignments in your software. You act on that feedback by rolling out a new feature that lets users distinguish between messages their colleagues sent and tasks assigned to them.
A customer satisfaction questionnaire can help you determine if customers find this new feature helpful. Customers’ feedback will reveal any pain points and possible solutions, so you can improve the product to better suit customer needs.
Reveals strengths and weaknesses
Brands can use surveys to learn where they’re getting it right or wrong. There’s a strong chance your business is doing better than the competition in some areas. But what about the missed opportunities?
These gaps may be blind spots for you but not for your customer base. With feedback from customer satisfaction surveys, businesses can identify holes in the buyer’s journey and find possible solutions.
Improves customer relationships
Customer satisfaction surveys make customers feel heard. When you ask consumers for their opinion, they’ll see that you care about their ideas and want to improve.
In turn, your customers are more likely to trust your brand—especially when you act on their feedback—and maybe even recommend it to their friends and family.
50+ customer satisfaction survey questions
There isn’t a single customer satisfaction survey template that will give you all the insights you need to improve your CX. Instead, tailor survey questions to different department needs and customer touchpoints. Use the following list of customer satisfaction survey questions that apply to various use cases.
- Demographic questions
- Product usage questions
- Quantitative customer feedback questions
- Follow-up questions
- Open-ended and long-form questions
- Nominal scale questions
- Ordinal scale questions
- Likert scale questions
- Semantic differential questions
- B2B questions
- B2C questions
Demographic questions
Questions that assess your customer demographics can help marketing and sales segment customers into buyer personas. Responses could lead to extremely valuable insights that influence revenue and support strategies. Demographic questions can validate existing data while revealing new patterns.
Examples of demographic questions include:
1. How many employees does your company have?
2. How old are you?
3. Where are you located?
4. Where did you first hear about us?
5. What is your main goal for using this website/product?
6. What industry are you in?
Product usage questions
Survey questions about how customers use your product or service allow your company to better understand the customer experience. Ask buyers what they like and don’t like about your offering, so you know what areas need improvement to keep your audience loyal.
Examples of product usage questions include:
7. How would you rate your purchase?
8. Would you recommend our product or service to a friend?
9. How can we improve our product offerings?
10. How do you use our product/service?
11. Which product feature do you consider the most valuable?
Quantitative customer feedback questions
Qualitative responses are important, but numbers are easier to measure. These survey questions can help you validate, confirm, or disprove problems and make decisions based on the data you receive.
Examples of quantitative customer feedback questions include:
12. How would you rate this interaction?
13. Please give your customer service representative a rating out of five stars.
14. How satisfied are you with your interaction with the support agent?
15. How easy was it to resolve your issue?
16. How likely are you to recommend [Product or Service Name] to others?
Follow-up questions
Follow-up questions ensure you’ve covered all your bases. Ask customers how they feel about recent interactions with your business. You can send follow-up questions after a buyer has finalized a purchase or contacted customer support.
Examples of follow-up questions include:
17. Thanks for reaching out to our customer service team and providing feedback. How can we improve our support offerings?
18. We are reaching out to customers who have made a purchase in the last few months. Can you provide more details about your experience?
19. Would you use [insert channel] again based on your experience? Please explain why or why not.
20. How would you describe your experience with our support agents?
Open-ended and long-form questions
Open-ended customer satisfaction questionnaires allow customers to voice their experiences and opinions in more detail. Descriptive responses can help you build better products, provide ideas for your knowledge base, and pinpoint areas of improvement.
Examples of open-ended and long-form questions include:
21. How would you describe your experience with our product?
22. What product feature isn’t working for you and why?
23. How can we improve your experience with our brand?
24. What is the primary reason for your score?
25. Is there anything you’d like to add?
Nominal scale questions
Nominal questions categorize answers into two or more variables. The options do not overlap, are usually qualitative, and have multiple-choice options, so you can’t use numbers to define your answers.
Let’s say you want to include other languages on your website so your readers across the globe can access information easily. You could ask:
What languages do you speak?
- Portuguese
- French
- German
- Spanish
- Russian
- Mandarin
- Other (Please specify)
Nominal scale responses are easy to collect and measure, but the questions sometimes restrict how customers express themselves.
Examples of nominal scale questions include:
26. What is your education level?
27. What is your gender?
28. What is your occupation/industry?
29. What is your education level?
Ordinal scale questions
Ordinal questions measure customer feelings or opinions using a set of ordered responses. They are arranged in a specific manner so that each response is greater or less than the other. For example, your doctor could ask you to rate your pain from a 1 (not so painful) to a 10 (extremely painful).
Examples of ordinal scale questions include:
30. How satisfied are you with our customer service?
31. How likely are you to recommend [Product or Service Name] to a friend or colleague?
32. How important is [feature] when purchasing a [product]?
33. How do you feel about [Product or Service Name]?
34. How was your experience with our product?
Likert scale questions
A Likert scale is an ordinal scale question that uses a five- or seven-point rating scale to gauge customer sentiment. Usually, Likert scale questions ask respondents to agree or disagree with statements. They provide more information than binary “yes/no” questions and are regarded as a more reliable way to measure customer satisfaction.
Say you want to find out how well a customer self-service option, such as your knowledge base, performs with your customers. You might frame your prompt as:
The knowledge base articles are helpful and informative.
- Strongly disagree
- Disagree
- Neither agree nor disagree
- Agree
- Strongly agree
You can also frame your prompts as questions:
How likely are you to purchase from us in the future?
- Very unlikely
- Unlikely
- Neutral
- Likely
- Very likely
Other options for answers might include phrases like “possibly,” “definitely,” or “somewhat unlikely,” depending on how you phrase the question.
Examples of Likert scale prompts include:
35. Rate your experience using [Product Name].
36. I found [Product or Service Name] easy to use.
37. The customer service I received was what I expected.
38. The website was easy to navigate.
Semantic differential questions
Semantic differential questions ask customers to rate an interaction, product, or brand by selecting where their feelings lie on a seven-point scale between polar adjectives.
Say you want to ask respondents about the quality of their interaction with a support agent. Your question and answer options might be:
How would you rate the support you received?
- Very satisfactory or unsatisfactory
- Strong or weak
- Pleasant or unpleasant
The customer will then choose how they feel on the scale between those two adjectives. With semantic differential questions, customers can choose responses that closely align with their feelings instead of simply agreeing or disagreeing with a statement.
Examples of semantic differential questions include:
39. Overall, the support I received today was:
40. Which of the following best describes your last experience with [Company Name]?
41. How likely are you to use [Product or Service Name] again?
42. How do you feel about [Product or Service Name]?
B2B questions
B2B survey questions aim to target other business professionals. Many times, B2B surveys are meant to gauge interest in a service or product to increase purchase rates. These types of questions also gather information on how to solve problems or improve offerings. You will usually tailor these questions to company size, job title, and industry.
Examples of B2B questions include:
43. How satisfied are you with [Company Name] as a business partner?
44. How closely did [Company Name] stick to the project plan?
45. How satisfied are you with our pricing plans?
46. How likely are you to hire our company again?
47. How likely are you to recommend our company to a colleague?
B2C questions
B2C survey questions differ from B2B questions because you target the general public or people who use your offerings rather than other business professionals. These questions are usually related to an experience that the end user had with the product or service.
Examples of B2C questions include:
48. How would you rate your stay at our hotel?
49. How was the service you experienced during your last visit?
50. Would you recommend our services to your family or friends?
51. How would you rate your support experience?
52. What’s the biggest problem you face when you use our product?
Types of customer satisfaction surveys

There isn’t only one way to find out how your customers feel. Different types of customer satisfaction surveys drill down into specific metrics such as overall satisfaction, effort, and loyalty. Learn more about the types of customer satisfaction surveys below.
Customer satisfaction score (CSAT)
Customer satisfaction score surveys indicate how happy customers are with a particular interaction or experience with your brand.

Say a customer just spoke to a support agent, and you want to find out if they got the help they needed. Your CSAT survey can ask, “How satisfied were you with the support you received?” Your customer can rank their experience on a scale from 1 to 5 or choose from options ranging from “very dissatisfied” to “very satisfied.”
To measure your CSAT score, divide the sum of all positive responses (responses from 4–5 or 7–10, depending on the scale) by the total number of responses collected. Then, multiply the result by 100. The percentage represents your satisfied customers.
Net Promoter Score (NPS)
Net Promoter Score® (NPS) surveys measure how likely a customer is to recommend your product or service to someone else. You will usually measure NPS surveys on a scale from 1 to 10. These surveys differ from CSAT surveys because they assess long-term customer loyalty and overall customer sentiment toward your brand.

To determine your NPS, compare the percentage of detractors (respondents who answer 0–6) to that of promoters (respondents who answer 9–10) to see where your company stands.
Customer Effort Score (CES)
Customer Effort Score (CES) gauges how much customer effort is required to complete a task, use your product, or get an issue resolved. Although similar to CSAT surveys, CES surveys isolate areas of customer friction.
This type of survey shows how easy (or difficult) buyers find interactions with your brand, so the metric is helpful for recognizing potential churn in customers. CES surveys typically feature a rating scale of 1 to 10, where 1 means “strongly disagree” and 10 means “strongly agree.”

Collect CES scores by sending out surveys that ask customers to rate their most recent support experience. To calculate your CES, divide the sum of all scores by the total number of respondents.
What to do with your customer satisfaction survey results
Now that you’ve successfully collected customer satisfaction survey responses, what do you do with them? Below, we cover how to turn your customer satisfaction survey results into action.
Respond to feedback
After receiving your customer satisfaction survey responses, close the loop by responding to those who participated. For positive feedback, thank them for their time—consider giving them a discount on their next purchase as a gift for completing the survey.
Address negative customer feedback by responding to it as soon as possible. Doing so can help establish brand trust and potentially retain the customer.
Look for trends and patterns
With customer satisfaction questionnaire results, you can identify areas to improve by looking at trends. Review the responses and see if you can spot any patterns. For example, if 40 percent of your customers stated that the wait time to speak with an agent was too long, you’ll know where there’s room for improvement.
Analyzing trends can also help you better understand the customer journey and where your customers experience pain points. For instance, perhaps you receive a lot of feedback about the checkout process being too complicated. From there, your team can strive to improve that stage of the customer journey to boost overall CX.
Share the results with the right people
After you collect the results from your customer satisfaction survey, distribute the findings and data to the right teams within your organization.
When multiple departments have this information, it ensures everyone is on the same page and can work towards the same goal, depending on the feedback you gathered. This can also prevent data silos and give agents the insights they need to deliver better support.

Free customer satisfaction survey templates
Get our free customer survey templates, question sets, and tips to help you gather insights on what you can improve.
Customer satisfaction survey templates
Our customer satisfaction survey templates can help you gather insights so you can work towards enhancing your CX. Download our templates and customize them with questions specific to your goals.
Best practices for designing a customer satisfaction survey

Creating a customer satisfaction questionnaire requires more than just asking the right questions. Be mindful of inherent biases, survey timing, and other key factors that can impact responses. Use the following tips as a guide for your customer satisfaction survey.
1. Begin every survey with a goal in mind
For feedback to be actionable, surveys should have an obvious and clear objective. So before sending out a survey, ask yourself: “What do we need to know that we don’t know?” This will help you identify your goals.
Say you recently rolled out a new prospecting feature for your sales CRM that speeds up the process of collecting information. You’re not sure what prevents customers from using the new feature, and you want to find out how you might increase engagement. With this goal in mind, you can ask customers specific questions about the feature.
2. Evaluate past examples of customer satisfaction surveys
As you create your customer satisfaction survey, you can evaluate past examples to spark inspiration and make improvements. If a previous survey didn’t collect enough responses, for instance, you should tweak your new one. Maybe customers didn’t fill it out because it was too long or had challenging questions, so as you create your next survey, you’ll need to ensure that you keep the survey brief and straightforward.
You could also draw inspiration from customer satisfaction surveys that you’ve received from other businesses. If you’ve come across a survey that enticed you to fill it out, take some of those elements and incorporate them into your own survey.
3. Keep survey questions simple and short
If your customers have to read your survey questions several times before they can understand the queries, you risk not receiving any responses. Along with question complexity, your survey length also affects response rates.
A SurveyMonkey study shows that the longer a survey is, the less likely customers are to complete it—abandonment rates increased for surveys that took longer than seven minutes. Consider keeping your surveys around three to five minutes long, with no more than 10 questions.
4. Use open-ended questions to get more details
Include one to two open-ended questions at the end of your survey to let your customers express themselves and ensure there aren’t any problems you’re missing. For example, after asking the customer to rate your product, you could prompt them to provide more details by stating, “In your own words, tell us about your experience with our product.”
While open-ended questions are your friend, you should limit your usage of them so customers don’t have to spend too much time writing responses.
5. Select the right delivery method
When building out your customer satisfaction survey, it’s important to choose the right delivery and collection method. First, pick which platform you want to use to gather responses. Some delivery methods include:
- Email: This is perhaps the most popular option, as you can follow up after a customer interaction with an email containing your survey.
- App pop-ups: Choose to have your survey pop up in an in-app widget. This option can narrow down usability issues. For example, this allows you to get feedback on a specific page of an app, like the checkout page.
- Live chat: You can send the survey when a live chat conversation with a customer ends.
- A landing page: On your website, create a landing page containing your surveys, and then share the links with your customers via email or social media.
If you’re not sure which delivery method is the best fit, you can test out a variety of platforms to see which one helps you collect the most responses.
6. Choose the right time to send surveys
The best time to send a satisfaction survey is when an experience is still fresh in the customer’s mind. A survey sent closely after the customer has interacted with a support agent is more likely to earn you accurate responses because that customer will still remember what happened and how they felt about the experience.
But you must also be careful not to send surveys too early. Customers need to have formed an opinion about their experience before you reach out to them.
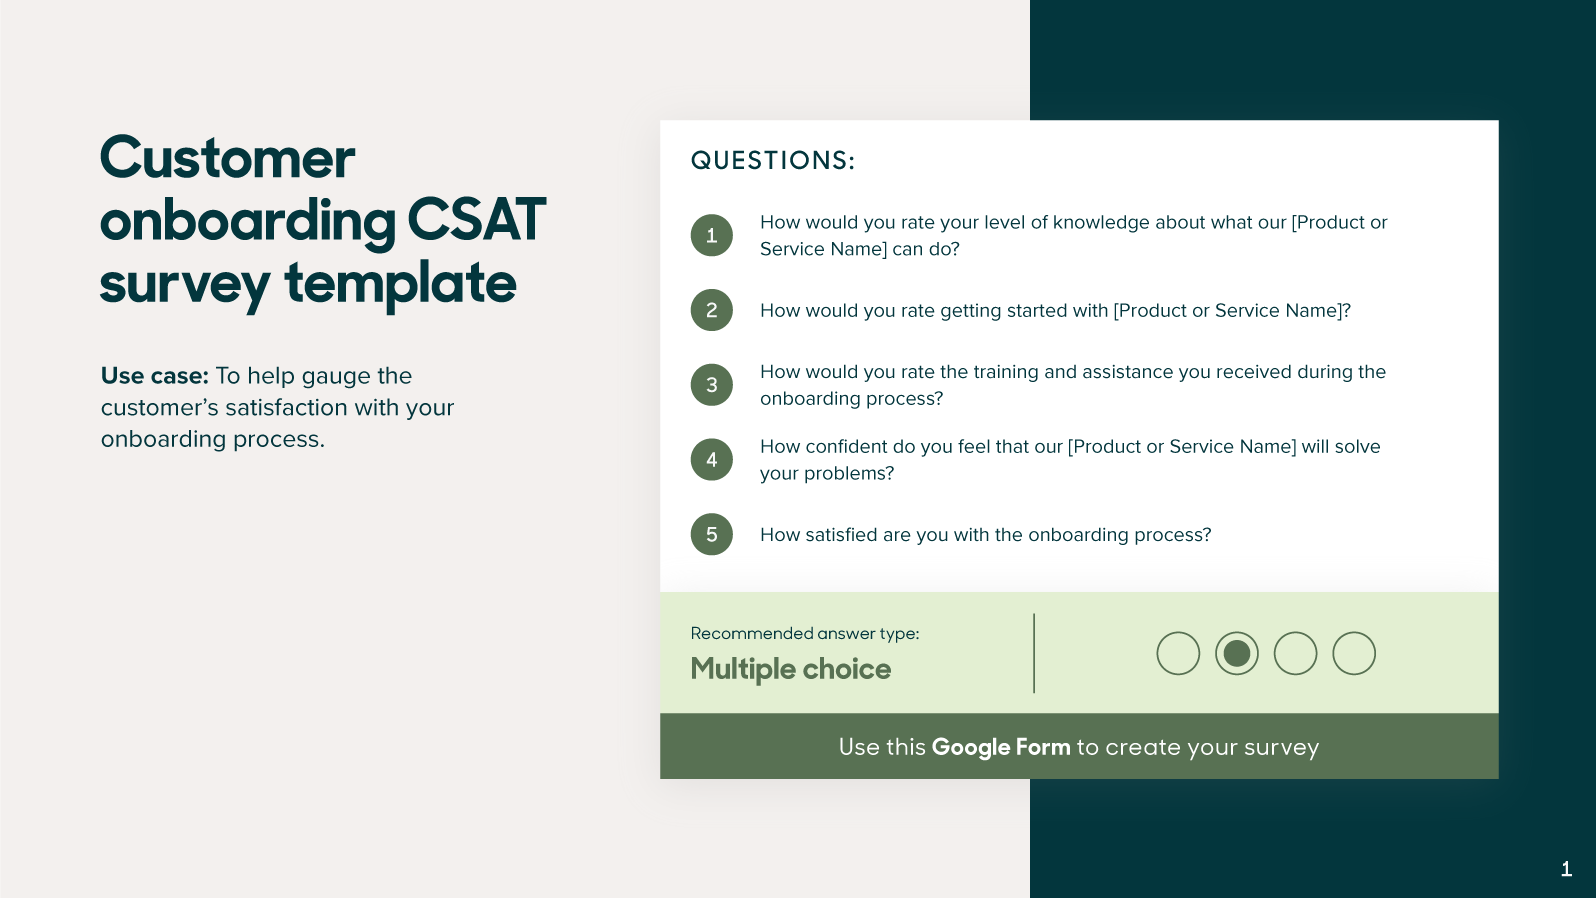
Send surveys at significant milestones and touchpoints during the customer journey, too. For example, when a new client finishes onboarding, send an in-app survey to ask about their experience.
Customer satisfaction survey examples
Ready to start creating your survey? Here are a few customer satisfaction survey examples to get the juices flowing.
General satisfaction CSAT survey example
A general satisfaction CSAT survey can help you determine how a customer feels about your brand overall. In the example below, Amazon asks customers about their general satisfaction with the Amazon Associates Program:

Here, the company uses a Likert scale to gather responses from customers.
Quality of service CSAT survey example
This type of customer satisfaction survey gauges how customers feel about the overall quality of the service they received. The following example from Namecheap uses survey questions to gather feedback around customer satisfaction with the support experience:

Namecheap uses the semantic differential approach that lets customers rate their experience on a sliding scale between two polar adjectives.
Turn survey responses into action
You’ve sent your first survey, and the results are in. Start by responding to your customers quickly and reassuring them that you’ll address their concerns.
Analyze the results for trends to see what customers want, and forward common issues to appropriate departments so they can come up with solutions. Acting on feedback shows your customers that you care about their experience and want to make improvements for the future—and that’ll keep them coming back.
To help find gaps in your customer service, download our customer satisfaction survey templates today.


